- DATE:
- AUTHOR:
- Cvent Product News Team

Exchange Solutions Releases for May 6, 2026
Cvent Supplier Network
Total Guest Room Pricing Updates
What's Changed: We’ve updated total guest room pricing in CSN, so required resort and housekeeping fees are captured and rolled into the totals you see when evaluating proposals. This helps remove hidden costs and makes it easier to understand the true price of each option before you award.
For new guest room RFPs created after May 6, 2026, CSN will now:
Require resort and housekeeping fees on supplier proposals whenever guest rooms are requested.
Automatically include room rate, resort fees, housekeeping fees, and applicable service charges in the total guest room cost.
Calculate fees based on total room nights to reflect the full stay, not just a single night.
Show clear minimum and maximum total guest room costs when multiple date options are included, in both proposal views and bid comparison reports.
Benefit: This update gives you clearer, all‑in guest room pricing with fewer surprises, so it’s easier to compare options across hotels and dates and stay aligned with evolving fee transparency rules. With totals calculated for you, you can quickly see the real cost of each option and make faster, more confident sourcing decisions.
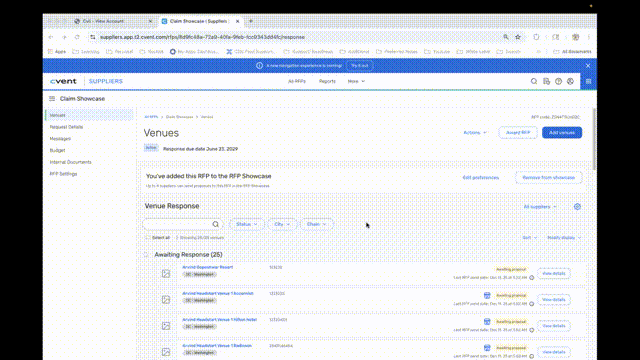
Fine-Tune RFP Showcase Preferences
What's Changed: We’ve added new Additional Preferences in RFP Showcase so you can fine-tune your venue requirements before you post an RFP. This gives you more control over which venues see your request and helps reduce declines caused by location or property mismatches.
When you add an RFP to Showcase, you’ll still see the Edit Preferences option. From there, you can now:
Set the distance from the city center for each preferred city so properties align with your attendees’ accessibility needs.
Set a distance from the airport to keep options convenient for groups arriving by air.
Use miles or kilometers for both distance filters, giving you precise control across all preferred cities.
Automatically include preferred venues and brands you’ve already identified for your account, so those partners are prioritized in matching.
These preference controls work alongside your existing RFP details to ensure only the most relevant venues see your request.
Benefit: This update is designed to help you get better venue matches with fewer declines, so you spend less time managing unqualified responses and more time planning your event.
CSN Reporting Updates
What's Changed: Enhanced table widgets, new gauge and donut charts, and the ability to download report charts as images are being released in CSN Reporting. For a full overview of these release details, see the Cvent Reporting Framework below.
Vendor Marketplace Powered by Reposite
NEW! AI Vendor Search for Planners
Expected Release Date: 04/29/2026
Meet AI Vendor Search in Reposite, a conversational, AI-powered way to discover vendors without the endless scrolling.
What's New: Start with a draft or active RFP, describe what you need in your own words, and within a few messages, you’ll receive a curated shortlist tailored to your event. Results seamlessly blend Reposite vendors with relevant options from the open web, so you can explore more, faster.
You’ll find AI Vendor Search directly within the My Suppliers page and in a dedicated tab. Simply use prompts like “LA restaurants for a 100-person private event” or “immersive team-building in Chicago” to instantly shape and refine your results. Reposite vendors are prioritized, with additional public options thoughtfully surfaced to help you uncover new ideas and hidden gems, all without leaving the platform.
Behind the scenes, intelligent guardrails keep the experience focused, secure, and genuinely useful, ensuring the AI stays on vendor sourcing and delivers clear, relevant responses every time.

Benefits: This release makes vendor sourcing faster, more creative, and more enjoyable in your planning process. By combining RFP details with conversational input, AI-powered search cuts down the time you spend hunting for options and gives you more energy to spend on strategy, storytelling, and experience design.
Bringing Reposite and open-web vendors together in a single, AI-guided flow also means better market coverage without extra tools or tabs. You get to high-quality matches sooner, uncover new vendor ideas along the way, and can source everything you need for an event in one intuitive, AI-powered workspace.
Cvent Event Diagramming
Professional Floor Plan Request Modal
Expected Release Date: 5/13/2026
What's Changed: The new Professional Floor Plan Request Modal inside Cvent Event Diagramming lets eligible planners and suppliers request professionally drawn, to-scale floor plans for venues that don’t yet exist in the floor plan library or don’t have a professional version today, all without leaving Event Diagramming.
Instead of uploading PDFs or working from rough sketches, you can now request accurate, reusable floor plans that support better planning, room design, and onsite execution.
Eligibility: The feature is available to eligible paid Event Diagramming accounts; it is not available on free plans.
Benefit: This update makes it much easier to get high-quality, to-scale floor plans for your venue, without manual workarounds or third-party tools.
Key benefits:
Save time: Skip the back-and-forth of sourcing or creating your own diagrams; request professional floor plans directly from Event Diagramming.
Improve accuracy: To-scale, professionally drawn floor plans help reduce layout errors and minimize last-minute onsite changes.
Standardize your library: Newly created plans are added to Floor Plan Finder, so you and other users can quickly reuse them for future events.
Increase transparency with venues: Community vs. Venue Verified tags make it

Cvent Reporting Framework: Impacting reporting for CSN, Cvent Passkey, and Cvent Travel
The following updates apply to Cvent Reports across products, including CSN reporting, Cvent Passkey, and Cvent Travel.
Enhanced Table Widgets in Reports
What's Changed: We’ve refreshed the report table widget experience to make it easier to scan, compare, and work with your data, without changing how your reports actually work behind the scenes.
Clearer layout and alignment: Each value now sits in its own dedicated cell with consistent spacing and alignment, so long text and dense grids are easier to read at a glance.
Improved readability: Header styling and row structure are more defined, making it easier to follow a row across the grid and distinguish columns in wide reports.
Reorder columns with drag-and-drop: Use the Reorder columns control to drag and drop columns into the order that works best for your analysis, no need to edit the report definition itself.
Resize columns directly in the grid: Adjust column widths so important fields (like titles or names) get more space, while less critical columns can be compressed.
Applies across reports: The new grid layout will be available for all reports and works alongside your existing reporting capabilities, without changing any current functionality.
Benefit: This update makes it easier for you to quickly understand and act on your report data, especially in wide or complex tables.
Scan dense reports faster with clearer cell structure and stronger visual separation between rows and columns.
Customize your view on the fly by reordering and resizing columns without changing the underlying report definition.
Keep existing workflows intact since the new layout does not alter any existing reporting functionality.
Drag and drop to reorder columns:

Resize columns:

New Gauge and Donut Charts in Reports
What's Changed: We’ve added new gauge and donut chart types, plus more flexible legend controls, so you can better visualize performance and category breakdowns in your reports.
Gauge charts let you track a single KPI (like registrations or revenue) against a goal, with configurable minimum, maximum, and target values and multiple style options (thin, medium, thick).
Donut charts offer a cleaner, more modern alternative to pie charts for category breakdowns, also with thin, medium, and thick ring styles.
For donut, pie, gauge, stacked bar, and stacked column charts, you can now choose where the legend appears (top, bottom, left, or right) to better fit your layout or slide design.
All existing reporting behavior (data, filters, access, exports) remains the same, only visualization options are expanding, and the change applies across all reports in these products.
Benefit: These updates give you more control over how you present your data, making it easier to communicate progress to stakeholders and quickly spot what needs attention.
Track goals at a glance with gauge charts that clearly show if you’re behind, on track, or ahead of plan.
Tell a clearer story with donut charts that make dense category breakdowns easier to read in dashboards and presentations.
Fine-tune your layouts by positioning legends where they best fit your slides or reports, reducing clutter and label overlap
A quick best practice: gauge charts work best when you’re tracking a single KPI against a well-defined goal; they’re not ideal for detailed multi-category comparisons.
Gauge Chart:

Donut Chart:

Legend Positioning:

Download report charts as images
What's Changed: Report users can now download high-resolution PNG images of their charts, so you can quickly reuse clean, on-brand visuals in presentations, documents, and email updates; no screenshots required.
Each supported chart in Reporting now includes an Export as PNG option in the chart controls. When you select this option, the system generates a high-resolution PNG that preserves the labels, legends, and colors exactly as you see them in the report. The exported images are optimized for common uses like slide decks, status reports, and email updates, so you don’t need extra editing or cleanup.
This option will appear wherever supported charts are available in reporting across Event Management Platform, Exhibitor Management, Passkey, Reporting, Supplier Network, and Surveys. Exporting as PNG is not available for grids. Existing reporting workflows are unchanged. This only adds a new way to export chart visuals for use outside the application.
Benefit: This update makes it much easier to share polished reporting visuals with stakeholders without spending time on manual cleanup or design tweaks.
Key benefits include:
Faster sharing: Quickly drop ready-to-use chart images into slides, docs, and emails.
On-brand visuals: Preserve colors, labels, and legends exactly as configured in your reports.
Less manual work: Skip screenshots and image editing—your exported file is presentation-ready.
Export Option in Reports:

Additional Resources
Cvent Community: Do you have questions about the updates we've rolled out this window? As always, get questions answered in the Community via the Open Forum.
Beta Opportunities Page: Help us make Cvent Products better by being the first to test products before they're widely available. Join Beta Programs.
UX Research Panel: Be part of a select group of users who will help guide the future of Cvent's products. Join the UX Panel.